Hi pal,
Do you tired looking for the forex strategy that can make money continuosly ?, if you do , great you’re at the right place.
You can call me Prasxz , actually I’m a programmer who interested in FOREX technical analysis, after I loss amount of money in this business , I start to asking into my self , why every I enter the market , its always against me ?, is there any proven system outhere that can avoid me being loss?
This system is FREE OF CHARGE.
For example :
You’re trading GBP for 10 times , how many times you loose your trade ? and how many times you’ve got your profit ?
If the answer is 8 wins and 2 losses, then you’re at the right system that match your style , next question is , can you keep your system working in the next 20,40,60,80,... trading round ?
If the answer is yes, please stop reading this strategy and keep your system on your side..
If no, may be I can help you here..
I will give you a simple trading system that has proven gave me minimum 20 pips/day ..not bad isn’t it ? and I still use this system as you see this blog.
Let’s see below MetaTrader 4 picture for 15 m GBP chart.
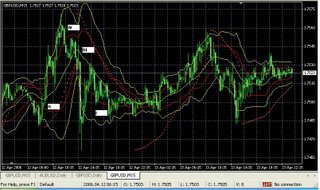
I used only 2 indicators :
- 2 Bollinger Band with parameter :
Period : 20 Deviations :1 Apply to :Close
Period : 20 Deviations: 2 Apply to: Close
This 2 Bollinger Band divide the area into 5 lines
- Parabolic SAR (Stop and Reverse) with parameter :
Step : 0.01 Maximum: 0.2
Bollinger Band
These 2 Bollinger Band can tell you, where the market will go on the next stage.
If the bar from below touched the line V it means please be prepared for the reversal into line IV. (In case there’s no bullish signal from higher time frame)
If the bar from above crossed the line IV it means please be prepared for the bar touched the line III.
If the bar from above crossed the line III it means please be prepared for the bar touched the line II.
If the bar from above crossed the line II it means please be prepared for the bar touched the line I.
If the bar from above touched/crossed the line I it means please be prepared for the reversal into line II.(In case there’s no bearish signal from higher time frame).
There are the possibilities for the market move on 2 Bollinger Band stage, you can examine this indicators to make sure or perhaps backtesting and forwardtesting on Meta Trader 4.
Parabolic SAR
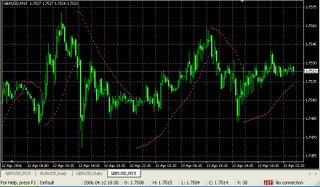
Use this indicators to determine the entry point and trailling stop.
PSAR strategy is BUY when the PSAR dot appears below the bar and SELL when the PSAR dot appears above the bar.
When the right time for me to BUY/SELL ?
Where I placed my stop loss ?
You should take BUY position when the FIRST PSAR dot appears below the bar and take SELL position when the FIRST PSAR dot appears above the bar.
Term of FIRST here is very important because this is a good chance for you to take a maximum pips, close your position when you gain 10 – 30 pips or more perhaps depend on market situation.
Place a STOP LOSS at the first PSAR dot when you already enter the market and trail it into next PSAR dot.
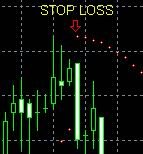
How many pips I should place my stop loss ?
It depend on your style, if you willing to place stop loss for 20 – 40 pips you should use 15 minute chart to gain profit between 10 – 30 pips or more , use the higher time frame if you want to gain bigger profit and of course your stop loss pips will be increased...you can try it because this system works in all time frame, depend on your style and equity.
I’m convenience using 15 m chart because the smaller stop loss pips and it doesn’t take too many time to gain 10 – 30 pips / day.
STRATEGY
BUY whenever FIRST PSAR dot appears and the bar lies above line I or above line II , target is next line.
SELL whenever FIRST PSAR dot appears and the bar lies below line V or below line IV , target is next line.
You can take position in all line depend on market situation , the most important is you must action when the FIRST PSAR dot appears.
Use this system consistently, if you loose your trade, you must switch position in the next FIRST PSAR dot .
OK that’s it , cut your losses and let your profit run...
PS : I don’t have experience using C language ..if there’s somebody would like to make EA (Expert Advisor) in MT4 base on this system ,you can share with me.
Case I :
hi all,
Ill show you about signal generated by the system, remember if the first PSAR appears and the price is at line V just wait until the price move back to line IV,III,II or I as long as the bar not touched the signalthen take position like below picture..
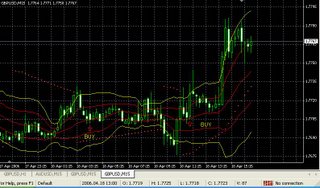
Case II
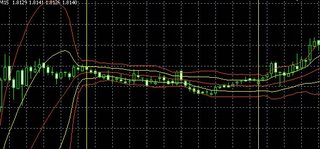
If you found ranging market or sideway trend like below picture ,you should wait and see till
long bottleneck end . Distance between line V and line I usually no more than 30 pips .
Below picture is sample of my balance sheet statement using this system...

forex trading hours
0 comments:
Post a Comment